eBay sales analytics start inside Seller Hub, which is free and already holds your sales, traffic, cost and seller-level data, plus a Research tab with up to three years of sold-item history. Most sellers do not need a new tool first. They need to know which report answers which question, and then decide whether a gap remains that an outside tool should fill.
This guide explains what eBay measures, where to find it, how to turn sold data into decisions about pricing and sourcing, how to review order data without jumping to unsupported conclusions about buyers, and what to require from any analytics tool you add.
What eBay sales analytics actually measure
The term covers two separate kinds of data, and mixing them up is the most common source of confusion. The first is your own performance: what you sold, what it cost you, and how buyers found you. The second is market data: what everyone sold, at what price, and how crowded a category is.
According to eBay's Seller Hub help page, Seller Hub is the free central place for managing an eBay business, consolidating orders, listings, marketing, advertising, store management, performance, research, payments and reports. Its Performance tab reports on sales, selling costs as a percentage of sales, traffic, buyer traffic source and seller level, and you can select data to open in-depth charts and graphs.
The Sales section within it breaks revenue into item sales, shipping and handling, government taxes and fees, and the percentage of sales that came from Promoted Listings. That last figure matters more than it looks: if a large share of your revenue arrives through paid promotion, your margin depends on ad rates, not only on item cost.
The core numbers to track every month
A useful monthly review does not need dozens of metrics. These are enough for most sellers:
| Metric | What it tells you | Where to find it |
|---|---|---|
| Total sales and item sales | Revenue trend, separated from shipping and tax | Performance tab, Sales |
| Selling costs as % of sales | Whether fees and ads are eroding margin | Performance tab |
| Sales via Promoted Listings | Dependence on paid visibility | Performance tab, Sales |
| Impressions, page views, click-through rate, conversion | Where listings lose buyers | Traffic Report |
| Seller level | Standing on cancellations, late shipments, unresolved cases | Performance tab |
| Sell-through rate | Demand against supply for a product | Research tab, plus your own math |
Reading your traffic data before you change a listing
The Traffic Report in Seller Hub shows high-level listing metrics: impressions, page views, quantities sold, average click-through rate and average sales conversion. eBay's cross-border trade handbook describes comparisons across time periods of up to 90 days.
The logic of reading it is a funnel:
- Low impressions: buyers are not seeing the listing. Look at the title, category, item specifics and price position.
- Healthy impressions, low click-through: buyers see it and skip it. Look at the main photo, the title wording and the price shown in search.
- Healthy click-through, low conversion: buyers open the listing and leave. Look at the description, shipping cost, returns terms and whether the item specifics answer the compatibility question.
Changing several of these at once makes the result unreadable. Change one element, wait for a comparable period, and compare. Our walkthrough of the eBay Traffic Report covers each column in more detail, and the listing quality report guide shows how to find listings missing basic data.
Using Product Research for pricing and sourcing
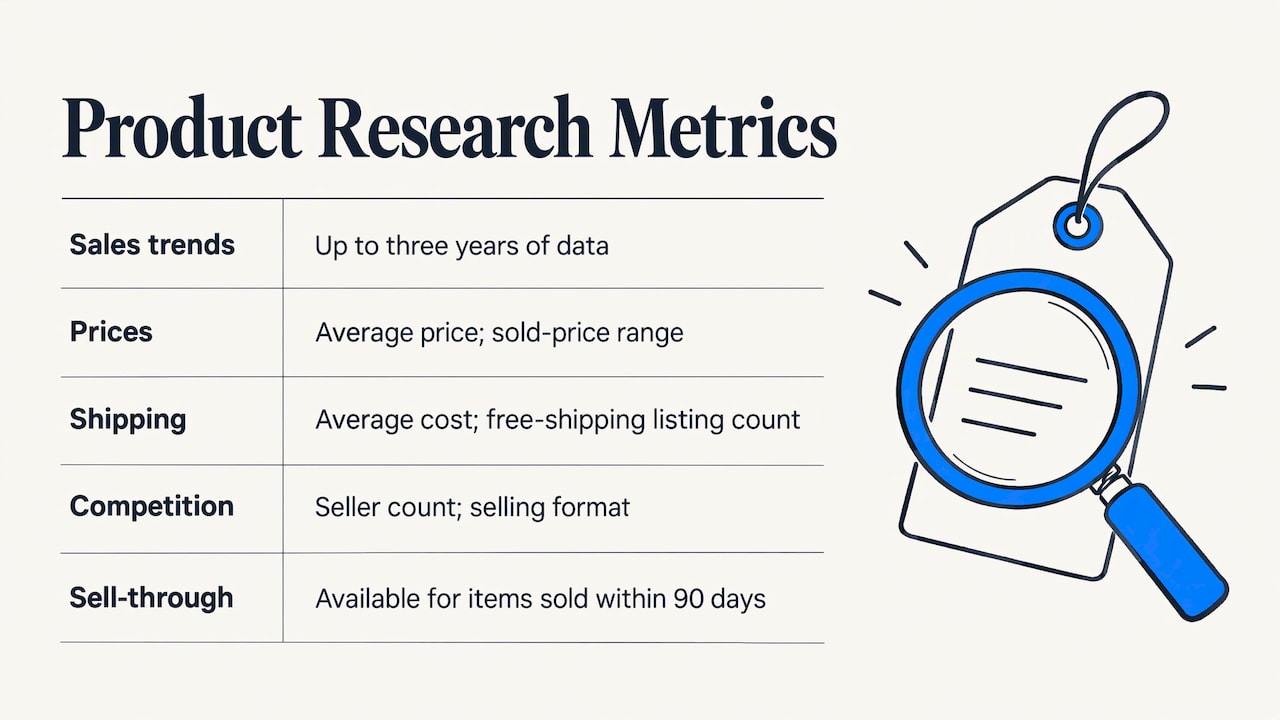
eBay's Product Research help page states that the tool gives access to up to three years of sales data for millions of items. The data includes sales trends, average sales price, sold price range, average shipping cost, the number of listings offering free shipping, the total number of sellers who have sold the item, and the selling format. A sell-through rate is available for searches of items sold within the last 90 days. You can search date ranges of any length within the three years.
eBay's research tools page for sellers says Product Research is free to all sellers, found under the Research tab in Seller Hub and also in the mobile app. A separate feature, Sourcing Insights, is available at no extra cost to business sellers with a Basic Store subscription or above, and it highlights categories with high demand and low supply.
A worked pricing example
Suppose you are about to list a used item and the Research tab shows a sold price range of $40 to $75 with an average of $58. Before you price at $58, check three things:
- Condition and completeness. Compare against sold listings in your condition, not the whole range. The spread is often explained by condition, not luck.
- Shipping. If most buyers in the data received free shipping, a $58 item plus $9 postage can look expensive next to a $62 free-shipping item, even though your total is higher.
- Format. A sold price from an auction and one from a fixed-price listing with accepted Best Offer behave differently. The tool reports the selling format, so filter by it.
The seller center page also suggests comparing the photos, price and item specifics of top-performing listings to find improvements and keywords, and watching price, volume and availability trends to forecast inventory and understand supply and demand shifts.
Sell-through rate before you buy stock
Sell-through rate is sold items divided by active listings, multiplied by 100. A high number suggests demand is outpacing supply, while a low one suggests too many sellers chasing too few buyers. Calculate it for a specific product, not a broad keyword, and compare it over more than one period so that a single strong week does not mislead you. Our sell-through rate guide walks through how to check it before you source inventory.
Seller Hub Reports for operations
The Performance and Research tabs are for looking. The Reports tab is for working in bulk. According to eBay's guide to Seller Hub Reports, high-volume sellers can create and upload files to add, revise, relist and end listings, identify and fix errors in bulk, manage feedback, and create, download and schedule reports.
The Listings insights module adds filters that matter for diagnosing sales. eBay's page on monitoring your business in Seller Hub says you can search listings by title and keyword, filter sales by sold via advertising, via Best Offer or via seller-initiated offer, and download listings sales reports, including one by Store Category. If you suspect that discounts or ads are doing most of the work, this is the filter set that confirms it.
Seller level is an analytics input too
The same eBay page explains that performance is assessed monthly, and a seller lands in one of three levels: Top Rated, Above Standard or Below Standard. The key measures include seller-initiated cancellations, late shipments and cases closed without seller resolution. A rise in late shipments is an operational signal that appears long before a level change, so track it weekly. Our guides to late shipment rate and eBay seller levels show the thresholds and the arithmetic.
Sellers who also run marketplaces beyond eBay will recognize the same discipline in other channels. A two-week ad metrics audit on Amazon, for instance, rests on the same principle: fix a review period, pick a few metrics, and compare against margin, not against vanity totals.
Reviewing order and return patterns without overreaching
Sales data also reveals problems that are not about demand. A cluster of "item not as described" claims on one SKU, repeated returns from the same buyer, or a sudden jump in cases after a listing change are all visible in order data if you look for them.
The risk is drawing the wrong conclusion. A pattern in the numbers is a reason to investigate, not evidence that a buyer acted dishonestly. A sensible sequence is:
- Check the listing first. Was the description, condition grade or compatibility information accurate? A flawed listing produces returns that resemble fraud.
- Check your fulfillment. Late shipments, damaged packaging or a carrier problem often explain a spike.
- Check the buyer's history in your own records. Is this a single event or a repeated one, and do you hold photos, messages and tracking to document it?
- Act on documented behavior only. Keep factual notes, dates and evidence, and avoid characterizing intent.
If the evidence does support a report, our community report form is built around submitting evidence for review, and the buyer status checker lets you look up a buyer's risk status before you ship a high-value order. Our reasoning for keeping reports evidence-based is set out in the section below.
Appliance parts: demand and compatibility
Parts sellers face a problem general analytics do not solve: demand data only means something if the part actually fits. Compatibility is usually decided by manufacturer part numbers and model numbers, so a sold-price figure for "refrigerator water filter" blends many incompatible items.
A more reliable method is to search by the OEM part number, then by known aftermarket equivalents, and record which appliance models each fits. Data providers that publish appliance-parts datasets describe doing exactly this: matching parts by manufacturer part numbers and GTINs to reconcile OEM listings with aftermarket equivalents, and mapping which refrigerator, washer, dryer and range models each replacement part fits from titles and descriptions. For your own catalog, the practical version is a spreadsheet keyed on part number, with the compatible models, sold price range and sell-through for each.

What to look for in an eBay analytics tool
Before paying for a tool, list what Seller Hub does not do for you. Based on the research, one independent write-up notes that Product Research data stays inside eBay: there is no export or API, results load 50 rows at a time, nothing runs on a schedule, and it covers eBay marketplaces only. Those are the gaps a tool can fill. Evaluate any option, by type, against these criteria:
| Criterion | Question to ask |
|---|---|
| Data source | Does it read your own orders and listings, market data, or both? |
| Time view | Can you see revenue by day, week, month and state? |
| Export and scheduling | Can you get the data out and receive it on a schedule? |
| Workflow fit | Does it work inside eBay or force you to switch tabs? |
| Connection to risk | Does order data connect to buyer-risk information? |
| Cost structure | Is there a free tier, and what limits apply on each paid tier? |
Broad categories of tools exist: market-research tools focused on competitor and product demand, listing-optimization tools, and order-and-revenue dashboards. They answer different questions, and most sellers need one of each at most. If you are also comparing listing tools, our guides to choosing a bulk listing tool and matching an AI listing tool to your workflow cover that side, and scheduling listings explains timing and limits.
Our perspective
Analytics on eBay tends to be discussed as a research problem: find the product, find the price. We think half of the picture is operational. Revenue figures mean little if returns, cancellations and a handful of problematic buyers quietly consume the margin.
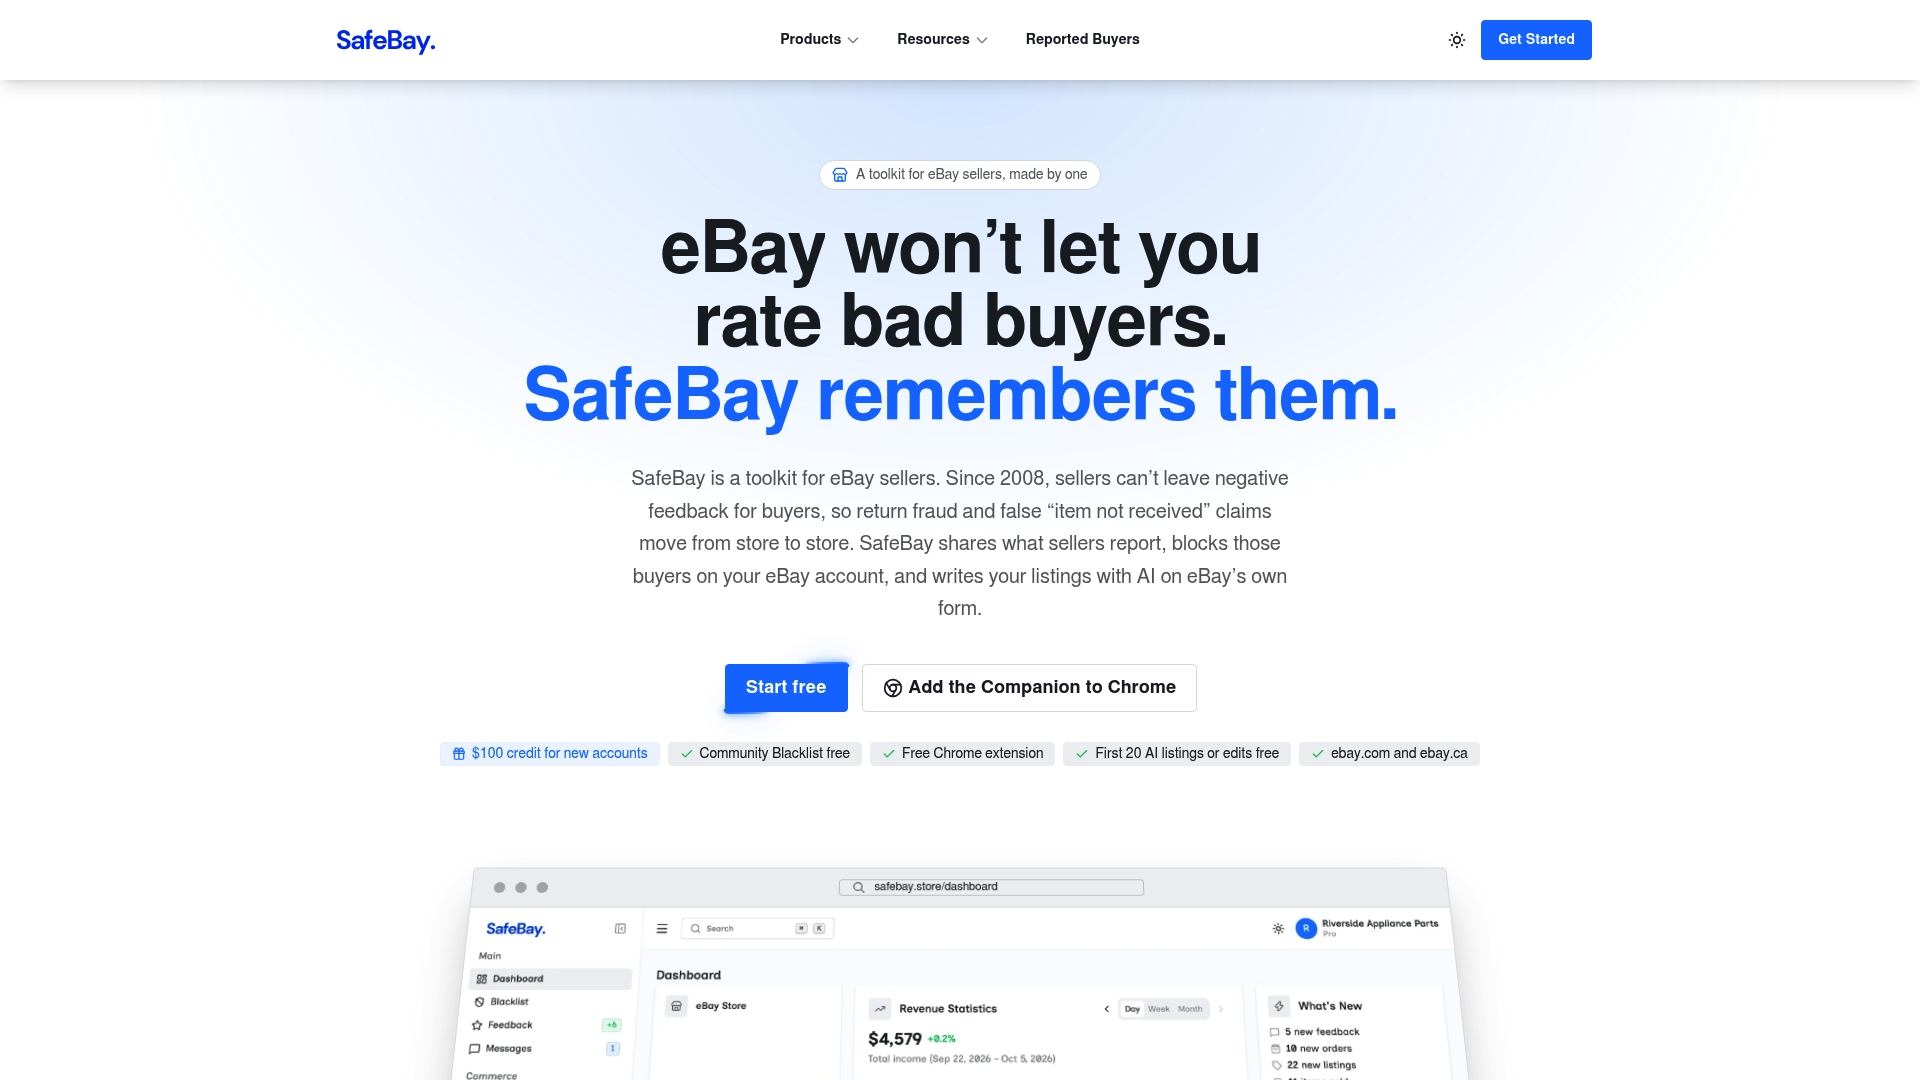
Since 2008, sellers have not been able to leave negative feedback for buyers, so the platform's own numbers show the cost of a bad transaction but give the seller no durable way to record who caused it. That is the gap we built SafeBay around. Sellers submit reports with evidence, the reports are reviewed, and confirmed problem accounts can be blocked through a free Chrome extension that syncs to the eBay Blocked Buyers list.
We separate private blocks from public ones, support appeals, and keep the reasons and dates of each listing, because a shared blacklist is only credible if it is accountable. The same logic applies to analytics: a number should always be traceable to a reason.
For sales reporting, we offer orders statistics by day, week, month and state alongside real-time buyer risk alerts, so that a revenue view and a risk view sit in the same workflow instead of in separate spreadsheets.
Mykola
Adding order statistics and buyer protection with SafeBay
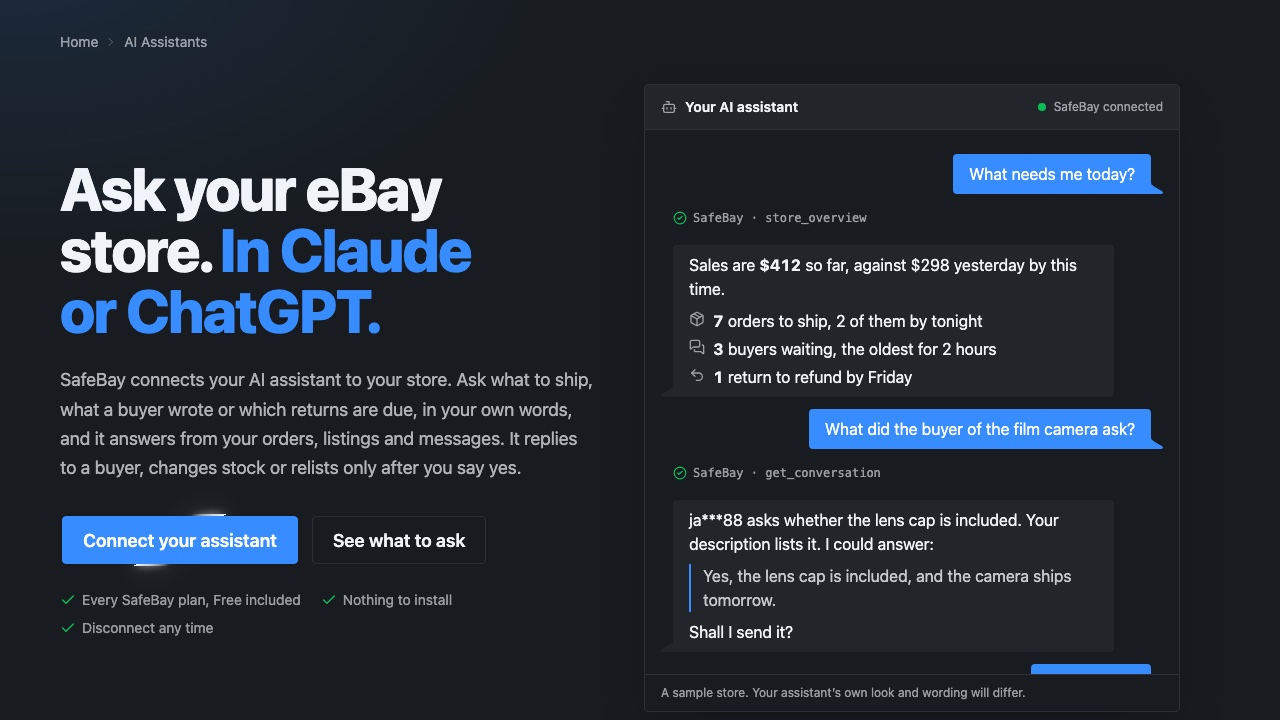
SafeBay is a toolkit for eBay sellers that includes sales analytics, an orders dashboard with revenue by day, week, month and state, a community-driven buyer blacklist, real-time buyer risk alerts, AI listing generation and proofreading, auto-relisting and order management tools. The SafeBay Companion extension brings these into eBay itself.
Plans, as published on our site: Free at $0 per month, Basic at $9.95 per month, Pro at $59.95 per month and Enterprise at $599.95 per month. The free plan includes basic features and limited AI usage, and paid subscriptions raise limits and unlock advanced features. You can start on the pricing and plans page, and the free seller tools include a listing analyzer with a score for checking a listing before you publish.
A simple monthly analytics routine
A routine takes less than an hour once it is set. Run it on the same day each month so the periods are comparable.
- Performance tab: record total sales, item sales, selling costs as a share of sales and the Promoted Listings share.
- Traffic Report: note impressions, click-through and conversion for your top ten listings and for any listing you changed.
- Listings insights: filter sold-via-advertising and Best Offer sales to see how much revenue depended on discounts or ads.
- Seller level metrics: check cancellations, late shipments and unresolved cases.
- Research tab: re-check sold price range and sell-through for products you plan to restock.
- Order review: list returns and cases, tie each to a listing or fulfillment cause, and note any buyer behavior you can document.
Keep the results in one sheet with a column per month. After three months the trend is more informative than any single figure.
FAQ
Where do I find sales analytics on eBay?
Open Seller Hub and use the Performance tab for your own sales, costs, traffic and seller level. The Research tab holds Product Research for market-wide sold data. Seller Hub is free, and Product Research is also available in the mobile app.
How far back does eBay sold data go?
Product Research provides up to three years of sales data, and you can search date ranges of any length within that window. The sell-through rate is available for searches of items sold within the last 90 days, so judge demand with that limit in mind.
Is eBay's own analytics enough, or do I need a separate tool?
For most sellers, Seller Hub covers the basics well. A separate tool becomes useful when you need exported or scheduled data, a revenue view by day, week, month and state, or a connection between order data and buyer-risk information. Decide on the gap first, then on the tool.
Can analytics prove that a buyer is committing return fraud?
No. Order data can show a pattern worth investigating, but it cannot show intent. Confirm that your listing and shipping were not the cause, keep evidence such as photos, messages and tracking, and report only documented behavior.
Sources
- Seller Hub | eBay
- Product research | eBay
- eBay research tools | Seller Center
- Cross-Border Trade Handbook, Chapter 5 | eBay
- How to use Seller Hub Reports | eBay
- How to monitor your business in Seller Hub | eBay
- PartSelect Datasets | Bright Data
- eBay product research: how to tell if it will sell | Apify Blog
- Amazon ad metrics and a two-week audit | Hypeworks